

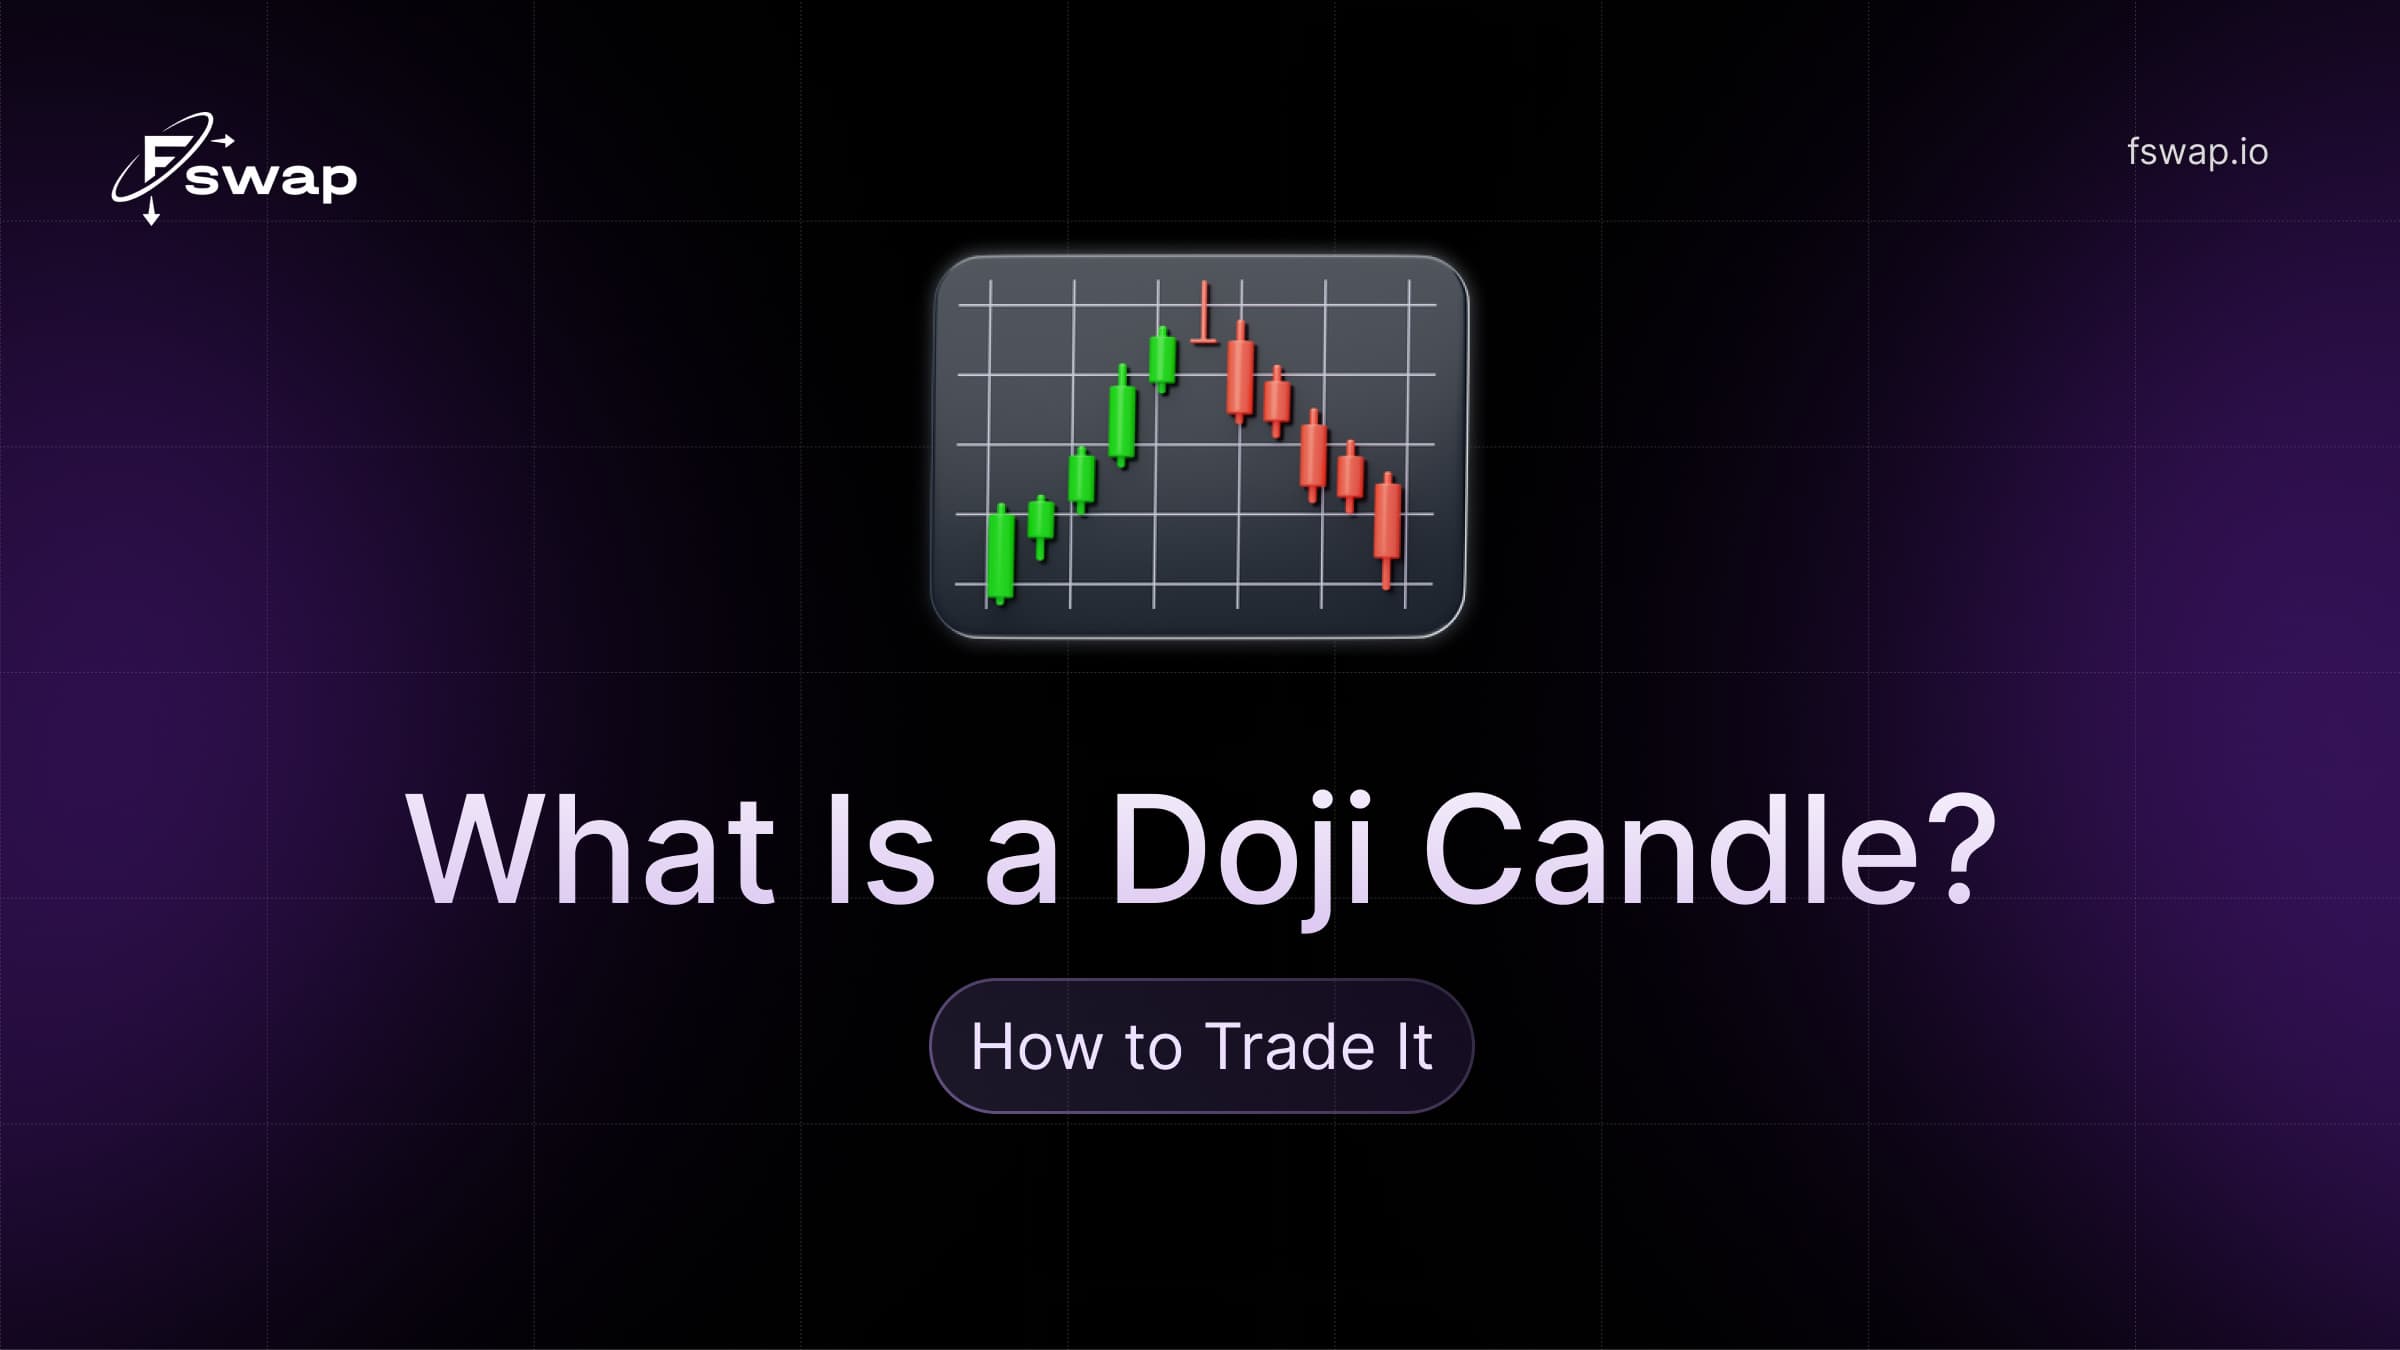
Most candlesticks tell a clear story — a long green body means buyers dominated the session, a long red one means sellers did. A doji tells a different story: nobody won. The open and close ended at nearly the same price, which means every push in either direction was absorbed and reversed before the candle closed. That standoff is exactly what makes the doji one of the most watched patterns in technical analysis — not because it gives you a direction, but because it warns you that the current direction may be about to change.
This guide explains what a doji actually is, the four main variations and what each one means, how to read context to separate signal from noise, and the step-by-step process for trading it without relying on the pattern alone.
What does a doji look like? A doji forms when a candlestick's open and close prices are virtually identical — within roughly 0.05–0.1% of each other — leaving almost no real body. What remains is a thin horizontal line or cross shape, with wicks extending above and below to show the range the price covered during the session before returning to where it started.
The name comes from Japanese — "doji" (同事) roughly means "at the same time," capturing the idea that buyers and sellers arrived at equilibrium simultaneously. The pattern shows up on any timeframe and in any market, but its meaning changes dramatically depending on where on the chart it appears and what was happening before it.
Why does a doji matter? A session where price travels a significant range but closes where it opened is a session where neither side could impose their will. After a sustained trend, that signals exhaustion — the bulls or bears who have been driving price are running out of conviction. The doji itself doesn't predict which side takes over next; it flags that a decision point is approaching. As Bulkowski's research on candlestick pattern effectiveness shows, a doji on its own has a success rate of around 50–55%, which is essentially a coin flip — but that rate improves meaningfully when the doji appears at key support/resistance and is confirmed by the following candle.
Not all dojis are the same. The shape of the wicks tells you more about the session's internal psychology than the body does.
The most neutral version. Open and close are nearly equal, with roughly symmetrical wicks above and below. Neither side pushed significantly harder than the other. On its own, a standard doji in the middle of a chart is mostly noise. What matters is whether it appears after an extended trend at a significant price level — that context is what turns a generic indecision candle into a meaningful signal.
Same tiny body, but with dramatically extended wicks on both sides. Price traveled a very wide range during the session — in both directions — before returning to the open. This pattern often appears after a major news event or a high-volume session that saw rapid swings absorbed by both sides. It signals extreme uncertainty: the market genuinely doesn't know where to go next, and a decisive move is likely building. In crypto, long-legged dojis frequently appear when a token breaks a major level in one direction, gets pushed back, breaks the other way, and still closes flat.
Open, high, and close are all at the same level — the top of the candle — while a long lower wick stretches downward. What this describes is a session where sellers pushed price down hard, but buyers stepped in aggressively and drove it all the way back to the opening level before the close. The lower wick represents full rejection of the lows. In a downtrend at a support level, this is one of the more reliable single-candle bullish signals — it shows that selling pressure was tested and buyers defended strongly. Confirmation from the next candle (closing above the dragonfly's high) is still required before acting.
The mirror image of the dragonfly. Open, low, and close are at the bottom; a long upper wick stretches upward. Buyers drove price up during the session, but sellers rejected the highs entirely and pushed it back to the opening level. In an uptrend at resistance, this is a bearish signal — the upper wick is a record of failed bullish momentum. Confirmation is again required, specifically a bearish candle closing below the gravestone's low.
The single most important rule in doji trading: a doji in the middle of a range or a consolidation is noise; a doji after an extended trend at a key level is a signal.
Four context factors determine whether a doji deserves attention:
These four factors work the same way across crypto charts as they do in traditional markets. This pattern and its context rules are covered in more detail in this breakdown of momentum trading and how to read signals in crypto — particularly the section on recognizing when a trend is losing steam.
Should you enter a trade on the doji candle itself? Almost never. Experienced traders treat the doji as a heads-up that a setup may be forming — then use the next candle to confirm which direction wins. Entering on the doji itself means betting on an outcome before the market has declared one.
Some of the most reliable doji-based setups aren't standalone patterns — they're the middle candle in three-candle formations:
In crypto markets, where trading runs 24/7 and true opening gaps are rare, these patterns still form — they're just typically gapless on intraday charts. The pattern loses some strength without the gap, but the three-candle logic (trend, indecision, reversal) remains valid.
If you use doji signals as part of a momentum-based trading approach and want to quickly reposition — for example, swapping from a volatile token into a stablecoin when a gravestone doji appears at resistance — a crypto-to-crypto platform like Fswap lets you make that swap directly from your wallet without routing through a separate exchange account, which reduces friction when timing matters.
A doji means that buyers and sellers ended a session at roughly the same price after competing throughout it — neither side won. It signals indecision or exhaustion in the current trend, and is most meaningful when it appears after a strong directional move at a significant price level.
Neither on its own — a doji is neutral. Its bias depends on context: a dragonfly doji (long lower wick) after a downtrend leans bullish; a gravestone doji (long upper wick) after an uptrend leans bearish. The confirmation candle that follows determines the actual direction.
No. A doji has a roughly 50–55% success rate on its own, which is close to random. The probability improves significantly when the pattern appears at support/resistance, on elevated volume, with RSI at an extreme, and is confirmed by the next candle's close.
The dragonfly doji — where open, high, and close are at the top of the candle with a long lower wick — is considered the most bullish doji variant. It shows that sellers drove price down hard but buyers rejected the lows completely and pushed price back to the open before the session closed.
Yes, with adjustments. In crypto markets, true opening gaps are rare due to 24/7 trading, which weakens gap-dependent variants like the Abandoned Baby. However, the core doji logic — indecision after a trend, confirmed by the next candle — applies directly. Higher timeframes (4H and above) are more reliable than minute charts.
Both signal indecision, but a spinning top has a visible small body — the open and close are close but not nearly identical. A doji has virtually no body. A doji represents more complete equilibrium between buyers and sellers; a spinning top still shows a slight directional edge during the session.
A doji is the market asking a question — and the next candle provides the answer. On its own, it's a flag that the current trend has lost conviction; in the right context, it's one of the clearest early warnings that a reversal is building. The key is using it as a filter, not a trigger: wait for confirmation, check volume and momentum indicators, and always know which side of a support or resistance level the candle is sitting on.
This article is educational content on technical analysis, not financial advice. Patterns are probability tools, not guarantees — always define your risk before entering any trade.
Elena leads marketing at Fswap and writes about cryptocurrency exchange: how swaps work, how to compare rates and fees, and how to keep funds safe without unnecessary KYC.